

Results day 2026 brought over 6.1 million GCSE grades to students across England, Wales and Northern Ireland. Behind the individual envelopes sits a much bigger data story: this article pulls together the full GCSE results statistics for 2026, compares them with previous years, and looks at what the numbers actually reveal about where standards are moving and where they are stuck. If you are trying to make sense of your child's results in context, exploring online private tutoring can also be a useful next step alongside understanding the national picture.
We have drawn every figure below directly from the Joint Council for Qualifications (JCQ), the body that collates results from all UK exam boards, and from Ofqual's own results dashboard. Where a comparison is possible, we have shown it.
📌 Key GCSEs Results Statistics at a glance for 2026:⚪️ 6,199,256 GCSE grades were awarded, up 0.6% on 2025. ⚪️ 67.3% of grades were graded 4/C or above, essentially flat on 2025's 67.4%. ⚪️ 22.0% of grades were graded 7/A or above, up slightly from 21.9% in 2025. ⚪️ 97.9% of grades were graded 1/G or above. ⚪️ English and maths results fell for a fifth consecutive year. ⚪️ 5.0% of grades in England were the top grade, 9, a small dip from 5.1% in 2025. ⚪️ Northern Ireland recorded the highest pass rate of the three nations for the 19th consecutive year, followed by England, with Wales recording the lowest. |

GCSE Results Statistics 2026: What Was the Overall Pass Rate?
The statistics of GCSE results for 2026 show a picture Ofqual itself describes as broadly "stable" year on year, rather than a dramatic swing in either direction.
Across the UK as a whole:
- 67.3% of grades were graded 4/C or above, compared with 67.4% in 2025, a fall of just 0.1 percentage points.
- 22.0% of grades were graded 7/A or above, up 0.1 percentage points on 2025's 21.9%.
- This marks the third year in a row that the standard pass rate has edged down slightly, continuing the gradual return towards pre-pandemic norms that began in 2023.
Total entries reached 6,199,256 across the UK, an increase of 0.6% on 2025's 6,160,034, driven partly by a slightly larger 16-year-old population than the previous year.
Recommended read: How to pass your GCSEs exams
Understanding GCSE Grades: What Do 9, 4/C and 7/A Mean?England moved from the traditional A*–G letter grades to a numeric 9–1 scale between 2017 and 2019, subject by subject, with the last A*–G GCSEs phased out by 2019. Wales and Northern Ireland still use the letter system for most subjects, which is why UK-wide statistics, like the ones in this article, are usually given at the points where the two scales are considered broadly equivalent, shown side by side as "7/A", "4/C" and "1/G".
Despite the numeric scale now being fully in place, Ofqual's own research has found that a significant proportion of parents and employers are still not confident reading it, particularly anyone who sat their own GCSEs before the change. The table below sets out the approximate correspondence between the two systems.
Two thresholds matter most in practice: grade 4 is the "standard pass", the minimum most further education courses and employers require, while grade 5 is the "strong pass", a higher bar increasingly used in government reporting and by more selective sixth forms. |

GCSEs Grade Distribution 2026: The Full Breakdown
In England specifically, 5.0% of grades awarded were the top grade of 9, a small dip from 5.1% in 2025. Grade 9 was designed to be harder to achieve than the old A*, so this figure tends to sit lower than older top-grade statistics from before the reform.
Looking at where grade 9s are most and least common by subject in England reveals a wide spread.
Subjects with the highest proportion of grade 9s (2026):
- Other Modern Languages: 41.0% (40.6% in 2025).
- Latin: 36.3% (34.5% in 2025).
- Chemistry: 14.7% (14.8% in 2025).
- Physics: 13.8% (13.8% in 2025).
- Biology: 13.7% (13.1% in 2025).
Subjects with the lowest proportion of grade 9s (2026):
- Science: Double Award: 1.1% (1.1% in 2025).
- English Language: 2.2% (2.3% in 2025).
- Engineering: 2.7% (2.4% in 2025).
- Citizenship Studies: 2.8% (2.6% in 2025).
- Mathematics: 3.4% (3.2% in 2025).
The gap between language and science subjects at the very top grade is partly a function of cohort size and self-selection. Fewer, often higher-attaining, students take subjects like Latin or Other Modern Languages, which naturally pushes the proportion of top grades higher than in a subject almost every student sits, such as English Language or Mathematics.
Where to Find Your GCSE Results
Results are issued directly by schools and colleges on results day itself, either in person or, increasingly, through online student portals. If a certificate or replacement result is needed later, JCQ does not hold individual student records; the correct first point of contact is always the school or college, with Ofqual's guidance on replacement certificates as a fallback for schools that have since closed.
GCSE Results Day 2026: Key Dates to Know
Results day itself is only one point in a longer calendar that runs from the moment exams finish through to the autumn resit window. The table below sets out the key dates for the 2026 GCSE results cycle.
|
Milestone |
Date |
|
GCSE results day 2026 |
Thursday, 20 August 2026 |
|
JCQ national results embargo lifted |
09:30, 20 August 2026 |
|
Deadline to request a review of marking (typical) |
Late September 2026 |
|
Autumn resits for English Language and Maths |
November 2026 |
Recommended read: How to Resit your GCSEs
2026 GCSE Results Statistics by Nation: England, Wales and Northern Ireland
GCSEs are reported across three separate jurisdictions, each with its own regulator: Ofqual in England, Qualifications Wales, and CCEA Regulation in Northern Ireland. Wales and Northern Ireland still grade some qualifications on the traditional A*–G scale rather than England's 9–1 scale, which is why UK-wide statistics are usually reported at the three points where the scales align: 7/A, 4/C and 1/G.
|
Nation |
Entries 2026 |
7/A and above |
4/C and above |
1/G and above |
|
UK-wide |
6,199,256 |
22.0% |
67.3% |
97.9% |
|
England |
5,719,431 |
21.8% |
67.0% |
98.0% |
|
Northern Ireland |
173,477 |
31.7% |
83.6% |
99.2% |
|
Wales |
289,506 |
19.6% |
62.3% |
96.9% |
Northern Ireland continues to record the strongest headline results of the three nations by a wide margin, a pattern that has held consistently for close to two decades. Wales records the lowest headline pass rate of the three nations in 2026, though its entries also fell more sharply than England's or Northern Ireland's, down from 307,089 in 2025 to 289,506 in 2026.

GCSE Results 2026 vs 2025: What Changed
|
Measure |
2026 |
2025 |
Change |
|
UK grade 4/C and above |
67.3% |
67.4% |
-0.1pp |
|
UK grade 7/A and above |
22.0% |
21.9% |
+0.1pp |
|
England grade 9 |
5.0% |
5.1% |
-0.1pp |
|
Total UK entries |
6,199,256 |
6,160,034 |
+0.6% |
The headline story of 2026 is stability, but two trends sitting underneath that top-line figure are worth pulling out separately.
- English Language pass rates (4/C and above) in England moved only slightly, but the subject remains one of those where a grade 9 is least common, at just 2.2%, alongside a longer-running decline in core English and maths outcomes that has now continued for five consecutive results days.
- The gap between England's best and worst performing regions widened again in 2026. London recorded the highest proportion of grade 7/A and above at 28.6%, while the North East recorded the lowest at 17.7%, a gap of 10.9 percentage points, up from 10.6 points in 2025.
- Entries moved in different directions across the nations: Wales saw entries fall 5.7% (from 307,089 to 289,506), while the UK overall rose 0.6% and England rose by a similar margin, making Wales's decline the outlier of the three.
- Unlike the widening regional gap in England, the gender gap actually narrowed slightly in 2026, with the female-male difference closing a little at each of the 7/A, 4/C and 1/G thresholds compared with 2025.

GCSE Pass Rate Trends: 2008 to 2026
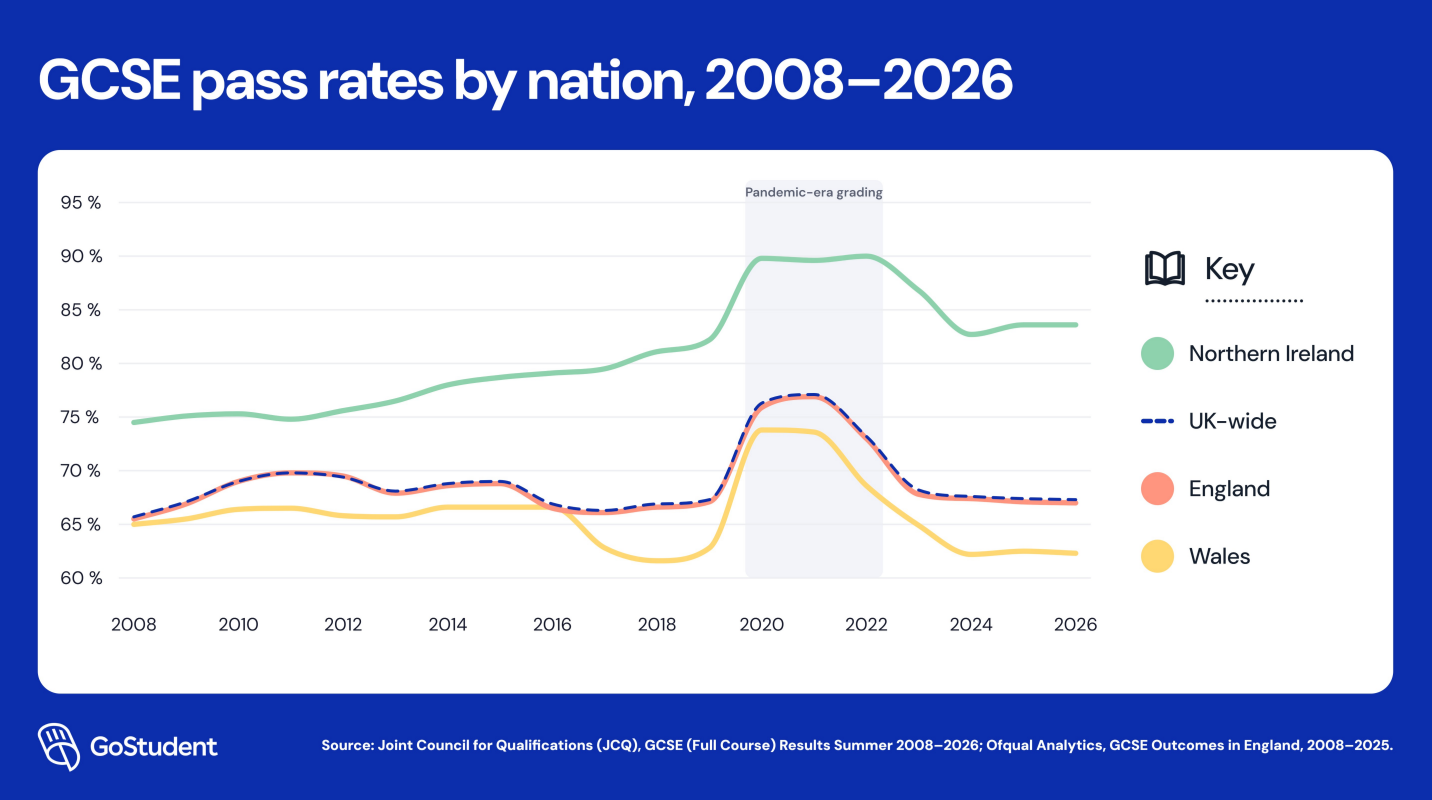
Looking at the last 18 years puts a single results day into much clearer context. Three distinct phases stand out: a gradual pre-reform climb, the 2020 to 2022 pandemic years, and the post-2023 return towards pre-pandemic standards.
|
Year |
UK 4/C+ |
UK 7/A+ |
England 4/C+ |
N. Ireland 4/C+ |
Wales 4/C+ |
|
2008 |
65.7% |
20.7% |
65.5% |
74.5% |
65.0% |
|
2009 |
67.1% |
21.6% |
66.9% |
75.1% |
65.5% |
|
2010 |
69.0% |
22.6% |
69.0% |
75.3% |
66.4% |
|
2011 |
69.8% |
23.2% |
69.8% |
74.8% |
66.5% |
|
2012 |
69.4% |
22.4% |
69.5% |
75.6% |
65.8% |
|
2013 |
68.1% |
21.3% |
67.9% |
76.5% |
65.7% |
|
2014 |
68.8% |
21.3% |
68.6% |
78.0% |
66.6% |
|
2015 |
69.0% |
21.2% |
68.8% |
78.7% |
66.6% |
|
2016 |
66.9% |
20.5% |
66.5% |
79.1% |
66.6% |
|
2017 |
66.3% |
20.0% |
66.1% |
79.5% |
62.8% |
|
2018 |
66.9% |
20.5% |
66.6% |
81.1% |
61.6% |
|
2019 |
67.3% |
20.8% |
67.1% |
82.2% |
62.8% |
|
2020 |
76.3% |
26.2% |
75.9% |
89.8% |
73.8% |
|
2021 |
77.1% |
28.9% |
76.9% |
89.6% |
73.6% |
|
2022 |
73.2% |
26.3% |
73.0% |
90.0% |
68.6% |
|
2023 |
68.2% |
22.0% |
67.8% |
86.8% |
64.9% |
|
2024 |
67.6% |
21.8% |
67.4% |
82.7% |
62.2% |
|
2025 |
67.4% |
21.9% |
67.1% |
83.6% |
62.5% |
|
2026 |
67.3% |
22.0% |
67.0% |
83.6% |
62.3% |
|
Note: "Pass rate" throughout this chart refers to the percentage of grades awarded at 4/C or above, the threshold used consistently across England's 9–1 scale and Wales/Northern Ireland's A*–G scale to allow direct comparison across all three nations. |
A few things stand out from nearly two decades of data:
- Pass rates rose steadily and gradually from 2008 to around 2011, before drifting slightly downward through the run-up to the 9–1 grading reform introduced from 2017 onwards.
- The 2020 and 2021 results are clear outliers across all four nations. With exams cancelled and grades based on teacher assessment, pass rates jumped sharply, peaking at 77.1% (4/C and above, UK-wide) in 2021, roughly ten percentage points above the pre-pandemic baseline.
- 2022 was a deliberate "midway" year between pandemic-era and pre-pandemic grading, and 2023 marked a full return to pre-pandemic grading standards, which is why the sharpest single-year fall in the entire dataset happens between 2022 and 2023.
- Northern Ireland has recorded the highest pass rate of the three nations in every single year from 2008 to 2026 without exception.
- Wales saw a sharper fall than England or Northern Ireland at the 2017 reform point, dropping over three percentage points between 2016 and 2017, before broadly stabilising in the 61–65% range for most years since.
- The single biggest year-on-year move in the entire dataset is not the 2022–2023 correction, but the jump between 2019 and 2020, when the UK-wide pass rate rose 9.0 percentage points (67.3% to 76.3%) as grading moved to teacher assessment during the pandemic.
- 2026's UK-wide pass rate of 67.3% now sits at exactly the same level as the pre-pandemic 2019 baseline, effectively closing the loop nine years after the 9–1 reform began and five years after pandemic-era grading ended.
- The gap between the strongest and weakest performing nations has widened considerably over time. Northern Ireland led Wales by 9.5 percentage points in 2008 (74.5% versus 65.0%); by 2026, that gap had more than doubled to 21.3 percentage points (83.6% versus 62.3%), with Northern Ireland climbing steadily while Wales has drifted downward.
- Wales has not recovered to its pre-2017 level in the way England and the UK overall have. Its 2026 figure of 62.3% remains close to its 18-year low of 61.6%, recorded in 2018, rather than returning to the 66%+ range it held consistently before the reform.

GCSEs Results Statistics by Subject: Highest and Lowest Pass Rates
Looking at UK-wide results by subject for 2026 gives a clear picture of where pass rates sit highest and lowest, though it is worth being precise about what this data can and cannot tell us.
|
Note The tables below rank subjects by their 4/C and above pass rate, UK-wide, 2026, limited to subjects with at least 1,000 entries so the comparison isn't skewed by very small, niche cohorts. A low or high pass rate is not the same thing as a subject being objectively "harder" or "easier": subjects like Mathematics and English Language are compulsory or near-compulsory for almost the entire student cohort, including students who find the subject genuinely difficult, while subjects like Latin or the separate sciences (Chemistry, Physics, Biology) are typically chosen only by students who are already performing well academically. A lower pass rate in a compulsory subject reflects who sits it as much as how difficult the subject itself is, so the tables below are best read as pass rate rankings rather than a straightforward difficulty ranking. |
Lowest pass rate GCSEs (lowest 4/C and above rate, 2026):
|
Subject |
Entries |
4/C+ (2026) |
4/C+ (2025) |
|
Mathematics: Numeracy |
18,417 |
49.4% |
52.1% |
|
Mathematics |
912,410 |
57.3% |
58.3% |
|
Science |
8,933 |
57.4% |
58.8% |
|
Motor Vehicle |
1,049 |
57.6% |
58.8% |
|
Science: Double Award |
1,007,628 |
58.3% |
57.8% |
|
English Language |
882,030 |
60.0% |
60.2% |
|
Engineering |
2,250 |
64.0% |
61.5% |
|
Psychology |
21,166 |
64.1% |
64.6% |

- Mathematics: Numeracy saw the sharpest year-on-year fall of any subject on this list, down 2.7 percentage points (52.1% to 49.4%), the single biggest single-year move across either table.
- Mathematics and English Language, the two subjects sat by almost every GCSE student in the UK (912,410 and 882,030 entries respectively), both saw pass rates edge down again, continuing the multi-year decline flagged earlier in this article.
- Science: Double Award, the single largest subject entry on either table at over one million students, bucked the trend among big-cohort subjects by improving slightly, up 0.5 percentage points.
- Engineering was the only subject here to see a meaningful rise, up 2.5 percentage points, though on a cohort of just 2,250 entries, a small subject like this is naturally more volatile year to year than a subject with hundreds of thousands of entries.
Recommended read: What's the Best Way to Pick Your GCSE Subjects?
Highest pass rate GCSEs (highest 4/C and above rate, 2026):
|
Subject |
Entries |
4/C+ (2026) |
4/C+ (2025) |
|
Irish |
1,707 |
94.8% |
94.4% |
|
Mathematics (Additional) |
4,520 |
94.5% |
95.0% |
|
Latin |
7,937 |
93.6% |
93.4% |
|
Other Modern Languages |
41,913 |
93.0% |
92.9% |
|
Chemistry |
171,024 |
92.0% |
91.5% |
|
Physics |
170,583 |
91.6% |
90.9% |
|
Biology |
180,769 |
89.6% |
89.4% |
- Physics recorded the largest improvement of any subject on either table, up 0.7 percentage points, with Chemistry close behind at +0.5.
- All three separate sciences, Biology, Chemistry and Physics, improved simultaneously in 2026 across broadly similar cohort sizes (170,000 to 180,000 entries each), pointing to a genuine, broad-based improvement rather than a one-off in a single subject.
- Mathematics (Additional) was the only subject in this group to fall, down 0.5 percentage points, even though it still held the second-highest pass rate overall at 94.5%.
- Irish posted the highest pass rate on either table at 94.8%, but also has by far the smallest entry count here (1,707), so its percentage is more sensitive to small shifts in cohort or grade boundaries than the larger subjects around it.
|
A note on our subject selection: JCQ publishes UK-wide pass rate data for around 50–60 individual GCSE subjects each year. Rather than reproduce the full list here, we've highlighted the subjects sitting at the extremes, the lowest and highest pass rates, since that's where the most meaningful contrasts in the data actually appear; most subjects in the middle of the range cluster fairly closely together and don't tell as clear a story. We've also applied a minimum threshold of 1,000 entries so the comparison isn't skewed by very small, niche subjects where a handful of students can swing the percentage significantly. If you'd like to see the full subject-by-subject breakdown for 2026, it's freely available directly from JCQ's website. |
Recommended read: GCSE Advice From Experienced Experts
How Private Tutoring Can Support GCSE Success
Whatever the national trends show, results ultimately come down to individual students and individual subjects. Exam results can feel like a single, high-stakes verdict, but they are rarely the full story of a student's ability or potential, and there is a great deal that can still change between now and the next set of exams. And one of the most reliable ways to change future exam outcomes is through academic help and tutoring.
Data from a 2024 study conducted by Dr Tricia Thrasher, analysing outcomes from 2,616 parents and students across seven European countries including the UK, offers some concrete evidence on the effect of personalised, one-to-one tutoring:
- Grade improvement: 3 in 4 students improved by up to three grades with one-to-one personalised tutoring, a pattern that held regardless of the student's country, age or school level.
- Subject-specific results in maths: among students who received consistent tutoring in maths, a subject where national pass rates have declined for five consecutive years, 80% who were tutored for 12 months improved by up to three grades.
- The link between confidence and results: 90% of students who reported increased confidence also improved their grades, suggesting the two outcomes reinforce one another rather than operating independently.
Where a particular subject, like maths or English, has consistently lower national pass rates, this data suggests that personalised, one-to-one support is associated with meaningful improvement in both grades and confidence. Online tutoring gives students one-to-one time with a tutor matched to their level, their exam board and the specific areas they are finding hardest, rather than a one-size-fits-all approach.
If any of this resonates, whether you're a parent weighing up next steps or a student wanting extra support, online tutoring is worth exploring with a free trial lesson to see if it's the right fit.

The Bigger Picture of this Year's GCSE Results Statistics
The GCSE results statistics for 2026 tell a story of overall stability, with the UK-wide pass rate settling almost exactly where it stood back in 2019, nine years after the 9–1 grading reform began and five years after pandemic-era grading ended. Underneath that headline figure, English and maths continue a longer, quieter decline worth watching, and pass rates vary considerably by subject and nation for reasons that go well beyond simple difficulty.
Understanding where a set of results sits against nearly two decades of context can make results day feel less like a single verdict, and for students or families looking to build on this year's results, personalised, one-to-one tutoring remains one of the most evidence-backed ways to do it.

SourcesOfficial and institutional sources🔗 Exam results data — Joint Council for Qualifications 🔗 GCSE outcomes in England — Ofqual Analytics GoStudent research🔗 Tutoring effectiveness study (2024), Dr Tricia Thrasher — GoStudent News coverage🔗 Schools Week: GCSE results 2026 analysis |


.jpg?upsize=true&upscale=true&width=100&height=100&name=math-square-root%20(1).jpg)