

Results day 2026 brought over 900,000 A Level grades to students across England, Wales and Northern Ireland, the highest total since comparable records began in 2003. This article pulls together the full 2026 A Level results statistics, compares them against data stretching back over two decades, and looks at what the numbers reveal about grades, subjects and nations.
If you are trying to make sense of a set of results in context, exploring online private tutoring alongside the national picture can be a useful next step.
We have drawn every figure below from the Joint Council for Qualifications (JCQ), the body that collates results from all UK exam boards, cross-checked against Ofqual's own published statistics. Where a comparison is possible, we have shown it.
📌 Key A Level Results Statistics at a glance for 2026:⚪️ 906,425 A Level entries were recorded across the UK, up 2.7% on 2025 and the highest total in the 2003–2026 series. ⚪️ 28.5% of grades were A*/A or above, up slightly from 28.3% in 2025. ⚪️ 9.6% of all grades were the top grade, A*, up from 9.4% in 2025. ⚪️ 97.5% of grades were graded E or above, the overall pass rate. ⚪️ Mathematics remained by far the most popular subject, with 115,380 entries, more than the next two subjects combined. ⚪️ Northern Ireland recorded the strongest results of the three nations on both headline measures in 2026, a pattern that has held almost every year since 2003, with Wales and England each edging narrowly ahead on pass rate only during the 2020 and 2021 pandemic grading years. ⚪️ The gender gap at A*/A has reversed since the late 2010s: male students now outperform female students on this measure, a gap that widened again in 2026. |

A Level Results Statistics 2026: What Was the Overall Pass Rate?
These 2026 A Level results statistics show a picture of broad stability at the national level, with a small but genuine rise in top grades.
Across the UK as a whole:
- 28.5% of grades were graded A*/A or above, up 0.2 percentage points on 2025's 28.3%,
- 97.5% of grades were graded E or above, essentially flat on 2025's 97.5%,
- 9.6% of grades were the top grade, A*, up from 9.4% in 2025.
Total entries reached 906,425 across the UK, an increase of 2.7% on 2025, and the highest figure recorded anywhere in JCQ's published results since 2003.
Understanding A Level Grades and UCAS Tariff PointsA Levels are graded A* to E, with U (unclassified) marking a fail. Unlike GCSEs, there is no numeric scale; A* was introduced in 2010 as an additional top grade above A, awarded for exceptional performance on top of the standard A grade boundary.
Each grade also carries a UCAS Tariff points value. Over 80% of UK universities have at least one course with a Tariff-point entry requirement, and nearly 70% of all courses nationally set requirements this way, alongside or instead of specific grade requirements.
Three A Levels at grades A, A, B therefore total 48 + 48 + 40 = 136 UCAS Tariff points. Not every university course sets requirements in points. Many still make offers in specific grade combinations (for example, "AAB"), so a Tariff total is best read as a general guide rather than a universal currency. |

A Level Grade Distribution 2026: The Full Breakdown
UK-wide, 9.6% of all A Level grades awarded in 2026 were the top grade, A*, up slightly from 9.4% in 2025. Because A* exists across all three nations, this figure covers England, Wales and Northern Ireland together, unlike GCSE's grade 9, which is an England-specific numeric grade.
Looking at where A*s are most and least common by subject (UK-wide, entries of 1,000 or more) reveals a wide spread.
Subjects with the highest proportion of A*s (2026):
- Other Modern Languages: 36.6% (40.4% in 2025),
- Mathematics (Further): 29.0% (28.9% in 2025),
- Mathematics: 17.7% (16.9% in 2025),
- Art and Design subjects: 16.5% (15.9% in 2025),
- German: 15.8% (16.5% in 2025),
- Physics: 11.5% (11.2% in 2025),
- French: 11.5% (11.6% in 2025),
- Digital Technology: 10.9% (10.6% in 2025),
- Spanish: 10.2% (10.5% in 2025),
- Chemistry: 9.4% (9.5% in 2025).
Subjects with the lowest proportion of A*s (2026):
- Health and Social Care (Single Award): 0.8% (0.6% in 2025),
- Accounting: 1.4% (1.9% in 2025),
- Statistics: 1.6% (3.1% in 2025),
- Media Studies: 2.0% (2.1% in 2025),
- English Language: 2.5% (2.4% in 2025),
- Film Studies: 2.7% (2.9% in 2025),
- English Language and Literature: 3.7% (4.0% in 2025),
- Environmental Science: 4.2% (4.4% in 2025),
- Business Studies: 4.2% (4.3% in 2025),
- Law: 4.8% (5.0% in 2025).
The gap between languages and mathematics-based subjects at the very top grade is partly a function of cohort size and self-selection: fewer, often higher-attaining, students take subjects like Other Modern Languages or Further Mathematics, which pushes the proportion of A*s higher than in a subject with a much larger, more mixed-ability cohort, such as Media Studies or English Language.

Where to Find Your A Level Results
Results are issued directly by schools and colleges on results day itself, either in person or through online student portals. JCQ does not hold individual student records, so the correct first point of contact for a lost certificate or a replacement result is always the school or college attended, with Ofqual's guidance on replacement certificates as a fallback for students whose school has since closed.
A Level Results Day 2026: Key Dates to Know
|
Milestone |
Date |
|
A Level results day 2026 |
Thursday, 13 August 2026. |
|
JCQ national results embargo lifted |
09:30, 13 August 2026. |
|
UCAS Clearing opens |
13 August 2026 (results day). |
|
Deadline to request a review of marking |
Late September 2026. |
Recommended read: A Level Private Candidate: What You Need to Know
A Level Results Statistics by Nation: England, Wales and Northern Ireland
A Levels are reported across three separate jurisdictions, each with its own regulator: Ofqual in England, Qualifications Wales, and CCEA Regulation in Northern Ireland. Scotland does not have A Levels; Scottish students take Highers and Advanced Highers instead, a different qualification reported separately.
|
Nation |
Entries 2026 |
A*/A and above |
E and above (pass rate) |
|
UK-wide |
906,425 |
28.5% |
97.5%. |
|
England |
835,606 |
28.3% |
97.5%. |
|
Northern Ireland |
33,824 |
30.7% |
98.9%. |
|
Wales |
32,633 |
29.6% |
97.7%. |
Northern Ireland recorded the strongest results of the three nations on both measures in 2026. On A*/A, this has held in every single year since at least 2003; on overall pass rate, Northern Ireland has led in 22 of the last 24 years, with Wales and England each narrowly ahead only during the 2020 and 2021 pandemic grading years. Wales outperformed England on both A*/A and overall pass rate this year, a notably different pattern from GCSE results, where England typically sits ahead of Wales.
Note: England's entry figure above (835,606) differs very slightly from the 835,950 cited in Ofqual's own August 2026 results blog; this is consistent with the usual gap between provisional, pre-enquiries figures and later-published totals, and both are correct for their respective publication dates.

A Level Results 2026 vs 2025: What Changed
Over 900,000 A Level grades were awarded in 2026, 2.7% more than in 2025, with a small rise in top grades across the UK. The tables below set out exactly what moved year on year, both in headline grade outcomes and in the gender split behind them. Two patterns stand out: a modest uplift at A*/A overall, and a widening gap between male and female students at that same threshold.
Table 1 - Grades, "A Level Results 2026 vs 2025: What Changed":
|
Measure |
2026 |
2025 |
Annual Change |
|
UK A*/A and above |
28.5% |
28.3% |
+0.2pp. |
|
UK A* only |
9.6% |
9.4% |
+0.2pp. |
|
UK E and above (pass rate) |
97.5% |
97.5% |
+0.1pp. |
|
Total UK entries |
906,425 |
882,653 |
+2.7%. |
Table 2 - Gender breakdown, "A Level Results 2026 vs 2025: By Gender":
|
Measure |
2026 |
2025 |
Annual Change |
|
Male A*/A and above |
28.9% |
28.4% |
+0.5pp. |
|
Female A*/A and above |
28.0% |
28.2% |
-0.2pp. |
|
Gender gap at A*/A (female minus male) |
-0.9pp |
-0.3pp |
Gap widened by 0.6pp. |
|
Male entries |
417,782 |
406,132 |
+2.9%. |
|
Female entries |
488,643 |
476,521 |
+2.5%. |
Note: the gender gap figures above are calculated from unrounded underlying data (based on JCQ’s official compiled data); recalculating from the rounded percentages shown elsewhere in this table may give a figure that differs by 0.1 percentage point.
The Northern Ireland entries bullet also goes, then, since nation-level figures sit in the earlier "by Nation" table, not in either of these two. Revised list, grades and gender only:
The headline story of 2026 is stability with a modest uplift in top grades, but several patterns underneath are worth pulling out separately.
- UK entries rose 2.7% overall, from 882,653 to 906,425, the fourth consecutive year of growth since the 2023 post-pandemic correction.
- The A* only rate grew faster in relative terms (9.44% to 9.62%) than the combined A*/A rate (28.3% to 28.5%), suggesting 2026's improvement sits mostly at the very top of the grade distribution rather than across the board.
- The gender gap at A*/A widened in 2026: male students outperformed female students by 0.9 percentage points (28.9% versus 28.0%), up from a 0.3-point male lead in 2025.
- Male entries grew faster than female entries (+2.9% versus +2.5%), even though female students still make up the larger share of the UK cohort in absolute terms (488,643 versus 417,782).
- Female entries remain the larger group by a wide margin, 70,861 more than male entries in 2026, even though male entries grew marginally faster in percentage terms (+2.9% versus +2.5%), the absolute gap between the two groups actually widened slightly since 2025 (when it stood at 70,389).
- The overall pass rate (E and above) barely moved, up just 0.1 percentage points (97.46% to 97.53%), showing this year's change is concentrated at the top grades rather than in whether students pass at all.
Recommended read: How Many A Levels Can You Take?
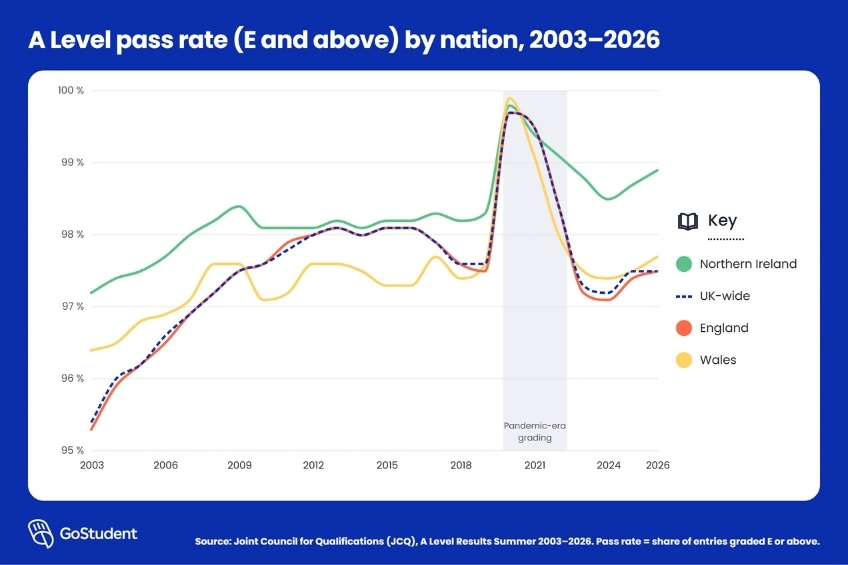
A Level Pass Rate Trends: 2003 to 2026
Looking at over two decades of data puts a single results day into much clearer context. Three distinct phases stand out: a gradual pre-reform period up to 2019, the 2020 to 2022 pandemic years, and a post-2023 return towards structurally comparable grading.
| Year | UK A*/A+ | UK E+ (pass) | England E+ (pass) | Wales E+ (pass) | N. Ireland E+ (pass) |
|---|---|---|---|---|---|
| 2003 | 21.6% | 95.4% | 95.3% | 96.4% | 97.2%. |
| 2004 | 22.4% | 96.0% | 95.9% | 96.5% | 97.4%. |
| 2005 | 22.8% | 96.2% | 96.2% | 96.8% | 97.5%. |
| 2006 | 24.1% | 96.6% | 96.5% | 96.9% | 97.7%. |
| 2007 | 25.3% | 96.9% | 96.9% | 97.1% | 98.0%. |
| 2008 | 25.9% | 97.2% | 97.2% | 97.6% | 98.2%. |
| 2009 | 26.7% | 97.5% | 97.5% | 97.6% | 98.4%. |
| 2010 | 27.0% | 97.6% | 97.6% | 97.1% | 98.1%. |
| 2011 | 27.0% | 97.8% | 97.9% | 97.2% | 98.1%. |
| 2012 | 26.6% | 98.0% | 98.0% | 97.6% | 98.1%. |
| 2013 | 26.3% | 98.1% | 98.1% | 97.6% | 98.2%. |
| 2014 | 26.0% | 98.0% | 98.0% | 97.5% | 98.1%. |
| 2015 | 25.9% | 98.1% | 98.1% | 97.3% | 98.2%. |
| 2016 | 25.8% | 98.1% | 98.1% | 97.3% | 98.2%. |
| 2017 | 26.3% | 97.9% | 97.9% | 97.7% | 98.3%. |
| 2018 | 26.4% | 97.6% | 97.6% | 97.4% | 98.2%. |
| 2019 | 25.5% | 97.6% | 97.5% | 97.6% | 98.3%. |
| 2020 | 38.6% | 99.7% | 99.7% | 99.9% | 99.8%. |
| 2021 | 44.8% | 99.5% | 99.5% | 99.1% | 99.4%. |
| 2022 | 36.4% | 98.4% | 98.4% | 98.0% | 99.1%. |
| 2023 | 27.2% | 97.3% | 97.2% | 97.5% | 98.8%. |
| 2024 | 27.8% | 97.2% | 97.1% | 97.4% | 98.5%. |
| 2025 | 28.3% | 97.5% | 97.4% | 97.5% | 98.7%. |
| 2026 | 28.5% | 97.5% | 97.5% | 97.7% | 98.9%. |
Note: "A*/A+" refers to the percentage of grades awarded at A* or A; A* did not exist as a grade before 2010, so figures before 2010 reflect the old A-and-above threshold only. "E+" refers to the percentage of grades awarded at E or above, the overall pass rate (grades A* to E all pass; only U is a fail). All figures are rounded to one decimal place for consistency across the table.
A few things stand out from over two decades of data:
- The 2020 and 2021 results are clear outliers across all four nations. With exams cancelled and grades based first on Centre Assessed Grades (2020) then Teacher Assessed Grades (2021), A*/A rates jumped sharply, peaking at 44.8% UK-wide in 2021, roughly 19 percentage points above the pre-pandemic baseline.
- 2022 was a deliberate "transitional" year graded midway between 2019 and 2021 standards, and 2023 marked a fuller return towards pre-pandemic grading, producing the sharpest single-year fall in the A*/A series between 2022 and 2023 (36.4% to 27.2%).
- 2026's UK-wide pass rate (E and above) of 97.5% now sits almost exactly where it stood in 2019 (97.6%), effectively closing the loop five years after pandemic-era grading ended.
- Northern Ireland has recorded the highest pass rate of the three nations in 22 of the last 24 years, the only two exceptions being 2020 and 2021, when Wales (99.9%) and England (99.5%) respectively edged narrowly ahead during the teacher and centre-assessed grading years.
- Northern Ireland's pass-rate lead has stayed remarkably stable over time: it led England by 1.9 percentage points in 2003 (97.2% versus 95.3%) and by 1.4 points in 2026 (98.9% versus 97.5%), a much smaller narrowing than the equivalent gap at A*/A.
- Entries moved in opposite directions by nation since 2003: England grew 21.6% (687,160 to 835,606) and Northern Ireland grew 18.1% (28,650 to 33,824), while Wales is the only one of the three nations with fewer entries in 2026 than in 2003, down 6.0% (34,727 to 32,633).
- Outside the pandemic years, 2026's UK-wide A*/A rate of 28.5% is the highest on record in JCQ's published results since 2003, surpassing the previous non-pandemic high of 27.0% set in both 2010 and 2011.
- 2026 entries, at 906,425, are the highest recorded anywhere in JCQ's published results since 2003, surpassing the previous high of 886,514 set in 2024.


A Levels Results Statistics by Subject: Highest and Lowest Pass Rates
Looking at UK-wide results by subject for 2026 gives a clear picture of where pass rates sit highest and lowest, though small movements here carry more information than the headline percentages might suggest at first glance.
|
Note: The tables below rank subjects by their E and above pass rate, UK-wide, 2026, limited to subjects with at least 1,000 entries so the comparison isn't skewed by very small, niche cohorts. At A Level, grades A* to E all count as a pass; only U (unclassified) is a fail. Because A Level subjects are chosen rather than compulsory, pass rates cluster very high across almost every subject, typically between 92% and 99.8%, a much narrower and higher band than at GCSE. A low or high pass rate here is not the same thing as a subject being objectively "harder" or "easier": subjects like Statistics or Physics are often chosen alongside more selective course combinations, while subjects with near-universal pass rates, like Drama or Art and Design, tend to draw students who are already confident in that area. If you'd like to see the full subject-by-subject breakdown for 2026, it's freely available directly from JCQ's website. |
Lowest pass rate A Levels (lowest E and above rate, 2026):
|
Rank |
Subject |
Entries |
E+ (2026) |
E+ (2025) |
|
1 |
Statistics |
1,140 |
92.7% |
93.0%. |
|
2 |
Accounting |
2,820 |
94.5% |
93.8%. |
|
3 |
Environmental Science |
2,521 |
94.8% |
95.0%. |
|
4 |
Physics |
45,800 |
95.7% |
95.4%. |
|
5 |
Computing |
20,009 |
95.9% |
95.7%. |
|
6 |
Chemistry |
65,541 |
96.0% |
95.7%. |
|
7 |
Law |
16,526 |
96.2% |
96.2%. |
|
8 |
Biology |
73,925 |
96.2% |
95.9%. |
|
9 |
Mathematics |
115,380 |
96.4% |
96.5%. |
|
10 |
Philosophy |
3,348 |
96.8% |
97.4%. |
|
11 |
Psychology |
79,201 |
97.1% |
97.0%. |
|
12 |
Physical Education |
13,057 |
97.4% |
96.9%. |
|
13 |
Digital Technology |
1,042 |
97.8% |
97.2%. |
|
14 |
Design and Technology |
10,874 |
97.8% |
97.1%. |
|
15 |
Political Studies |
24,824 |
97.9% |
98.0%. |
- Statistics recorded both the lowest pass rate on this list and a decline on 2025, down 0.3 percentage points, despite its comparatively small cohort of 1,140 entries.
- Mathematics and Biology, two of the largest cohorts on either table (115,380 and 73,925 entries respectively), both sit in the lower half of this list, showing the pattern isn't confined to small, niche subjects.
- Philosophy saw the sharpest year-on-year fall of any subject on this list, down 0.6 percentage points (97.4% to 96.8%).
- Accounting, Computing, Chemistry, Biology and Digital Technology all improved slightly, suggesting the lower end of the pass rate distribution saw more upward movement than downward in 2026.
Highest pass rate A Levels (highest E and above rate, 2026):
|
Rank |
Subject |
Entries |
E+ (2026) |
E+ (2025) |
|
1 |
Drama |
7,397 |
99.8% |
99.5%. |
|
2 |
Health and Social Care (Single Award) |
3,545 |
99.6% |
99.3%. |
|
3 |
Art and Design subjects |
42,620 |
99.5% |
99.4%. |
|
4 |
Performing/Expressive Arts |
1,244 |
99.4% |
99.3%. |
|
5 |
Film Studies |
7,761 |
99.4% |
99.4%. |
|
6 |
German |
2,294 |
99.4% |
99.6%. |
|
7 |
Media Studies |
15,009 |
99.3% |
99.2%. |
|
8 |
English Language |
13,192 |
99.3% |
99.2%. |
|
9 |
English Language and Literature |
7,382 |
99.3% |
99.5%. |
|
10 |
English Literature |
36,196 |
99.3% |
99.3%. |
|
11 |
Classical Civilisation |
3,708 |
99.1% |
99.2%. |
|
12 |
Spanish |
8,434 |
99.1% |
98.9%. |
|
13 |
History |
46,960 |
99.0% |
99.1%. |
|
14 |
Other Modern Languages |
6,944 |
99.0% |
99.0%. |
|
15 |
French |
6,888 |
98.8% |
98.7%. |
- Drama recorded both the highest pass rate on either table and the largest year-on-year improvement, up 0.3 percentage points (99.5% to 99.8%).
- Art and Design subjects, the single largest cohort on this list at 42,620 entries, improved slightly to 99.5%, showing a high pass rate here isn't limited to small subjects.
- German was the only subject on this list to decline, down 0.2 percentage points (99.6% to 99.4%), while the other two modern languages here, Spanish and French, both improved.
- History and English Literature, two of the largest humanities cohorts (46,960 and 36,196 entries), both sit comfortably above 99%, consistent with the generally narrow spread across this entire table.

Recommended read: Motivation and Students: Key Statistics
Entries by Subject: The Most and Least Popular A Levels
Beyond grade outcomes, entry numbers reveal their own story about student choice. Mathematics alone accounts for roughly one in eight A Level entries in the UK, far outstripping every other subject, while a handful of niche options attract only a few dozen students nationwide.
The lists below set out the ten most and ten least taken subjects in 2026 based on entries, offering a useful counterpoint to the grade-based rankings elsewhere in this article: popularity and performance do not always move together.
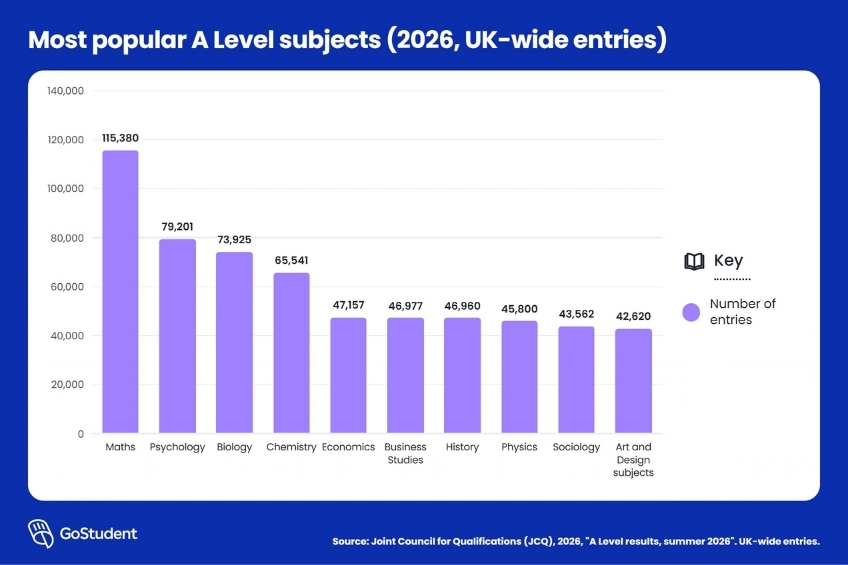
Most popular A Level subjects (2026, UK-wide entries):
- Mathematics: 115,380 entries, by far the most-taken A Level, accounting for around one in eight of all entries,
- Psychology: 79,201 entries,
- Biology: 73,925 entries,
- Chemistry: 65,541 entries,
- Economics: 47,157 entries,
- Business Studies: 46,977 entries,
- History: 46,960 entries,
- Physics: 45,800 entries,
- Sociology: 43,562 entries,
- Art and Design subjects: 42,620 entries.
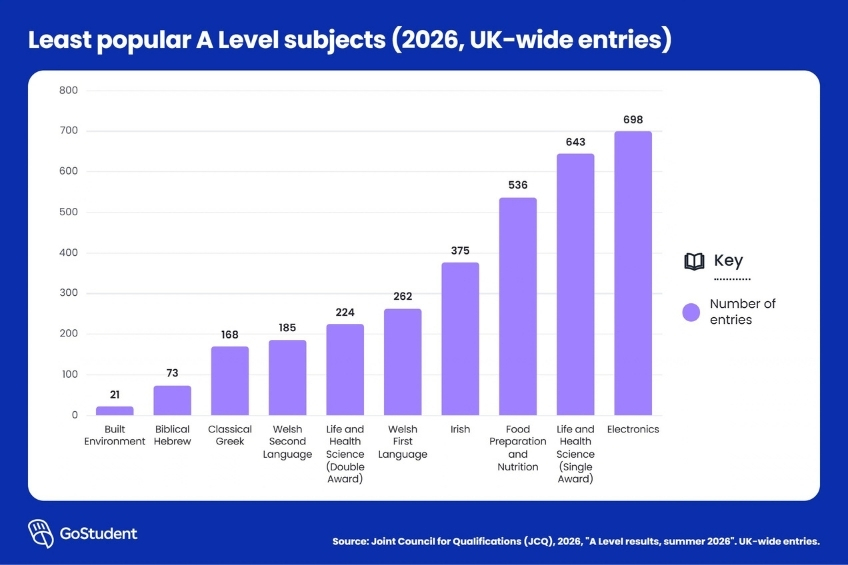
Least popular A Level subjects (2026, UK-wide entries):
- Built Environment: 21 entries,
- Biblical Hebrew: 73 entries,
- Classical Greek: 168 entries,
- Welsh Second Language: 185 entries,
- Life and Health Science (Double Award): 224 entries,
- Welsh First Language: 262 entries,
- Irish: 375 entries,
- Food Preparation and Nutrition: 536 entries,
- Life and Health Science (Single Award): 643 entries,
- Electronics: 698 entries.
Recommended read: The Best A Level Revision Websites
How Private Tutoring Can Support A Level Success
Results ultimately come down to individual students and individual subjects, and there is a great deal that can still change between one set of exams and the next. Data from a 2024 study conducted by Dr Tricia Thrasher, analysing outcomes from 2,616 parents and students across seven European countries including the UK, offers some concrete evidence on the effect of personalised, one-to-one tutoring:
- 3 in 4 students improved by up to three grades with one-to-one personalised tutoring, regardless of country, age or school level,
- 80% of students tutored in maths for 12 months improved by up to three grades,
- 90% of students who reported increased confidence also improved their grades.
For students working towards specific UCAS Tariff totals, this kind of targeted support via online tutoring is an option worth exploring.
The Bigger Picture of the 2026 A Level Results Statistics
The 2026 A level results statistics point to a year of broad stability with a modest rise in top grades, set against the highest entry total recorded since 2003. Northern Ireland continues to lead the three nations, Mathematics remains the dominant subject by entries, and the gender gap at A*/A has quietly reversed direction over the past two decades. Understanding where a single results day sits against this wider context can make the numbers feel less like an isolated verdict, and for students building on this year's results, personalised one-to-one tutoring remains one of the more evidence-backed routes forward.

SourcesOfficial and institutional sources🔗 Exam results data — Joint Council for Qualifications GoStudent research🔗 Tutoring effectiveness study (2024), Dr Tricia Thrasher — GoStudent |


.jpg?upsize=true&upscale=true&width=100&height=100&name=math-square-root%20(1).jpg)